
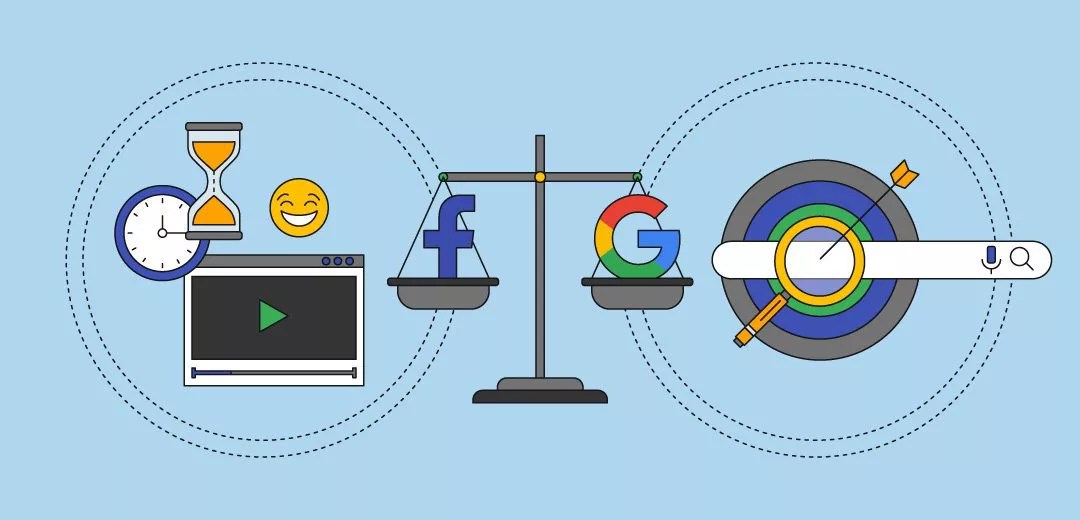
Google or Facebook – Which platform is better and where should your clients invest their money?
The answer is… it depends.
In recent years, the battle between these two advertising behemoths has heated up. They seem to be going punch for punch with updates and innovative user experience changes.
For example, earlier this year Google started showing local search ads in Google Maps and expanded text ads with more characters on the search engine results page.
These are just two examples of an ever-evolving ad experience from the search engine, who is continually twisting and tweaking their approach to both satisfy advertisers and increase ad revenue.
Facebook is much the same. In the last 12 months alone they have introduced Messenger ads, injected ads during videos, and changed the way their audience targeting operates.
All of these innovations are bred from intense competition. Facebook is no longer the new kid on the block when it comes to digital advertising. Their platform is maturing, and subsequently, the costs are going up for advertisers. So even though a number of businesses made the migration across to Facebook ads due to its low cost and high engagement levels, things are evening up.
Now the biggest question facing advertisers and agencies alike is “where do I spend my money?”.
The rest of this article will aim to answer that question by taking an objective look at both ad platforms.
Note: We will compare Facebook Ads with Google Search Ads, not the other forms of Google Ads such as Display, Youtube, etc.
Google Ads vs Facebook Ads: The Fundamental Differences
 The simple difference is this: Google Search Ads are driven by user intent, whereas Facebook ads act as an interruption.
‘Let us elaborate…
When a user navigates to the Google search engine, they are looking for something specific. That may be a piece of information, a product, a service, a funny fact, a video, or any number of things. But all of those things are pre-determined prior to them opening the search bar.
Simply understanding this notion is powerful information for advertisers because more often than not a prospect is towards the end of their buying journey by the time they click on one of your ads. For example, if someone searches for “affordable dental surgery in New York,” it is pretty clear and precise what they are looking for.
The Facebook audience, on the other hand, is made up of people trying to fill in time. They are scrolling through their newsfeed, seeing what their friends are up to and trying to spot the next hilarious meme or cat video they can tag someone in. They have no intent to buy at this point so you are interrupting them with an advertising message that may or may not be relevant to them at that particular time.
One thing Facebook has to its advantage is advanced audience targeting such as custom audiences based on user behavior, lookalike audiences determined by complex matching algorithms, and interest or location-based targeting based on demographic information. These targeting features are like the options you have available on the Google Display Network but with another level of granularity and accuracy. However, even with advanced audience targeting you can never be 100% sure that your Facebook ad will be seen by someone who is searching for “affordable dental surgery in New York,” unlike the Google ads example.
Another thing we do know is that engagement on Facebook is wavering. The Pew Research Center surveyed over 4,500 Facebook users and found that 74% of them have either adjusted their privacy settings, taken a break from checking their Facebook account, or deleted the app from their phone entirely:

Does that mean that Google wins the battle with no contest?
No. It’s not that simple. You see, given the maturity of Google Search Ads, you are in fierce competition with other advertisers in a lot of sectors. This means that for certain industries, clicks and conversions can be relatively expensive to Facebook ads. Plus, sometimes people simply don’t go to Google to search for something they need and an advertisement on another platform, such as Facebook, can trigger buying behavior. This is especially evident in some industries that have very low search volume for product or service-based keywords. In the end, the right advertising platform is contextually based on a variety of factors such as; budget, industry, location, and expected ROI. As an agency, you’ll need to use your expertise to guide your client down the right path.In the next two sections, we’ll provide some general recommendations and data about the best-performing industries on both ad platforms based on conversion rates. But we give this information with a strong word of warning.
Just because historical data suggests that one industry performs better than another, these statistics are nothing more than averages based on a statistically meaningful sample size. Yes, they are a good guide. But they shouldn’t be your only guidepost for making budgetary decisions for clients. Each campaign you run will have a long list of variables that you should test, iterate, and optimize, in order to get the results your clients desire. These tests are the only way to accurately make decisions on where you should allocate budget, not industry benchmarks.
In saying that, this is a good starting point:
Which business types have the highest conversion rates on Google Ads?
Mobile Searches- Legal (6.95%)
- Hair Salons (5.95%)
- Construction (4.64%)
- Healthcare (4.24%)
- Automotive Service and Repair (4.06%)
- Transportation (3.83%)
- Arts and Entertainment (3.54%)
- Internet and Telecom (3.33%)
- Business Services (3.16%)
- Retail (3.11%)
- Finance & Insurance (7.19%)
- Consumer Services (5%)
- Advocacy (4.61%)
- Real Estate (4.4%)
- Legal (4.35%)
- Education (4.13%)
- Employment Services (3.97%)
- Home Goods (3.68%)
- Dating and Personals (2.75%)
- Industrial Services (2.58%)
Which business types have the highest conversion rates on FacebookAds?
- Fitness (14.29%)
- Education (13.58%)
- Employment & Training (11.73%)
- Healthcare (11%)
- Real Estate (10.68%)
- B2B (10.63%)
- Customer Services (9.96%)
- Finance and Insurance (9.09%)
- Beauty (7.10%)
- Home Improvement (6.56%)